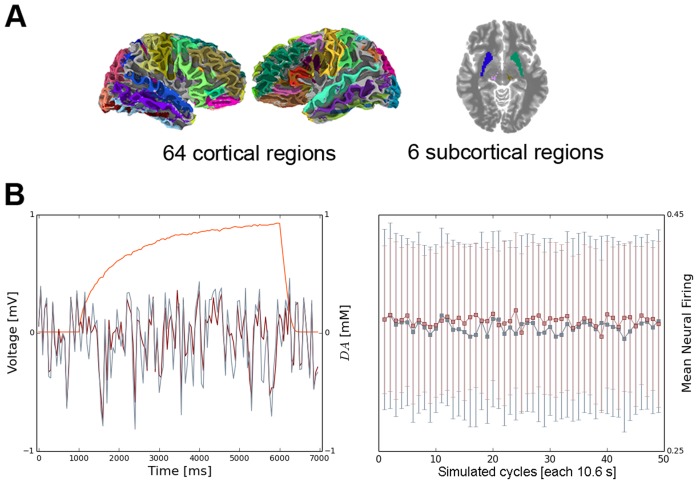
Figure 1. (A) Schematic overview of the whole-brain parcellations and (B) temporal evolution of LMC membrane potentials and firing rates.
(A) The whole brain was parcellated into 70 regions of interest, including 64 cortical and 6 subcortical areas. (B) The left panel shows the time-course of excitatory membrane potentials  with (red) and without (blue) dopamine modulation overlayed with the corresponding time-evolution of
  (orange) during one dopamine release cycle. The right panel illustrates the evolution of
  with (red) and without (blue) dopamine modulation for fifty simulated cycles (each 10.6 s). Boxes indicate mean firing rate values averaged across a cycle, errorbars show corresponding standard deviations.

