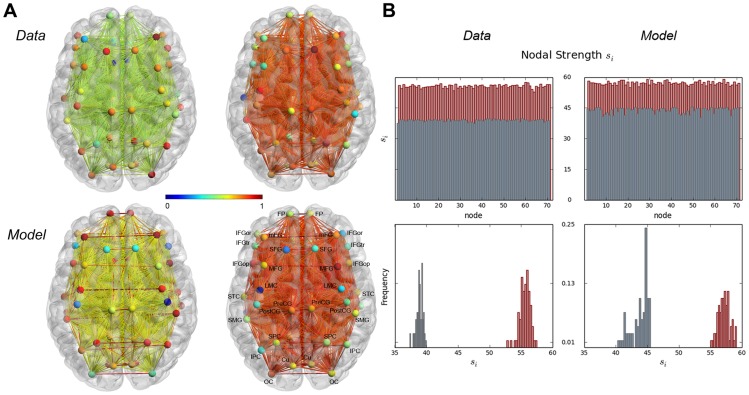
Figure 3. (A) Empirical and simulated functional networks in the resting state and during speech production and (B) nodal strength for experimental (left column) and simulated (right column) functional networks in resting state (gray) and during speech production (red).
(A) 3D visualizations of data- and model-based NMI networks (top and bottom rows, respectively) during rest (left column) and speech production (right column). Edge colors represent NMI coefficient values and nodal color illustrates strength (normalized to the interval  ). (B) Nodal strength of data- and model-based NMI networks. The top row shows the nodal strength per node, the bottom row illustrates the distribution of si-values. The 3D networks were visualized with the BrainNet Viewer (http://www.nitrc.org/projects/bnv/). Abbreviations: MFG = middle frontal gyrus, Cu = cuneus, FP = frontal pole, FG = fusiform gyrus, IPC/SPC = inferior/superior parietal cortex, LMC = laryngeal motor cortex, OC = occipital cortex, PreCG = precentral gyrus, IFGop/IFGor/IFGtr = pars opercularis/pars orbitalis/pars triangularis of the inferior frontal gyrus, PostCG = postcentral gyrus, STC = superior temporal cortex, mFG = medial frontal gyrus, SFG = superior frontal gyrus, SMG = supramarginal gyrus.

