
Figure 2.
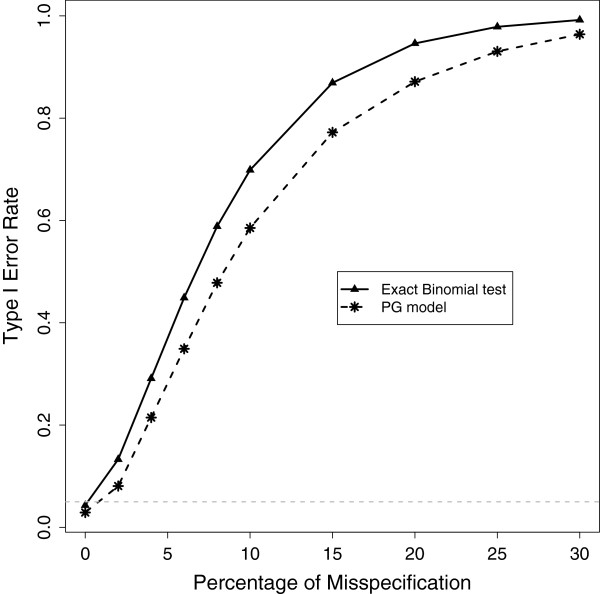
Type I error rate of the PG model with q = 1/2 and the binomial test, with increasing levels of bias. The x axis is the percentage of misspecification as bias increases above 0.5. That is, B = 0.5(1 + x %) with x represented by the the horizontal axis. The horizontal line (grey) through 0.05 is shown for reference.