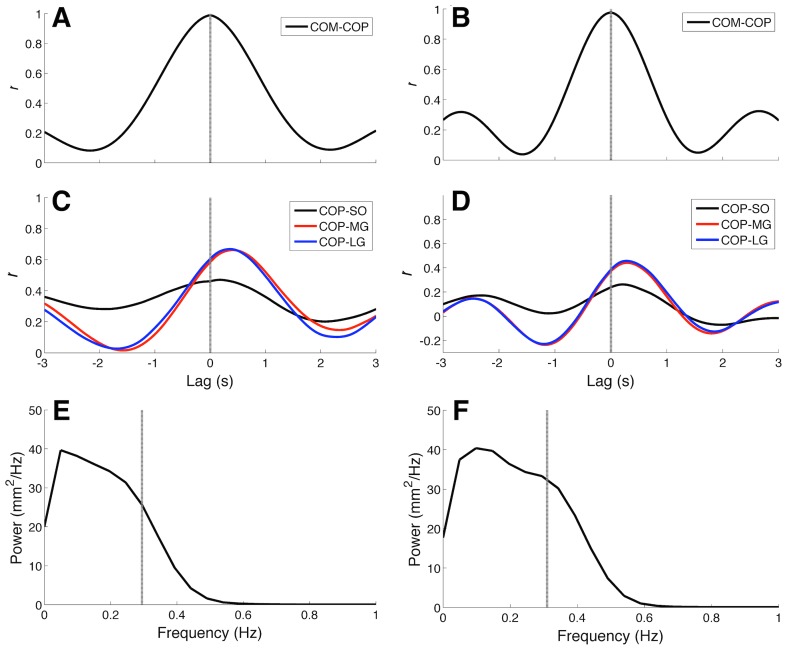
Figure 2. Cross-correlation functions and centre of pressure (COP) power spectra for typical simulations carried out on Model 1 (graphs A, C, and E) and Model 2 (graphs B, D, and F).
(A-B) Cross-correlation functions between centre of mass (COM) and COP. Note that for both models, cross-correlation peaks occurred at zero lag (dashed lines). (C-D) Cross-correlation functions between COP and muscle electromyograms (EMGs). Black, red, and blue curves represent cross-correlation functions for Soleus (SO), Medial Gastrocnemius (MG), and Lateral Gastrocnemius (LG), respectively. Irrespective of the model structure, there was a lag of about 300 ms between COP and EMG envelopes from the three muscles. (E-F) COP power spectra. Dashed line represents the 50% power frequency ( ). It is noteworthy that for Model 2 there was a broader bandwidth in comparison to Model 1.

