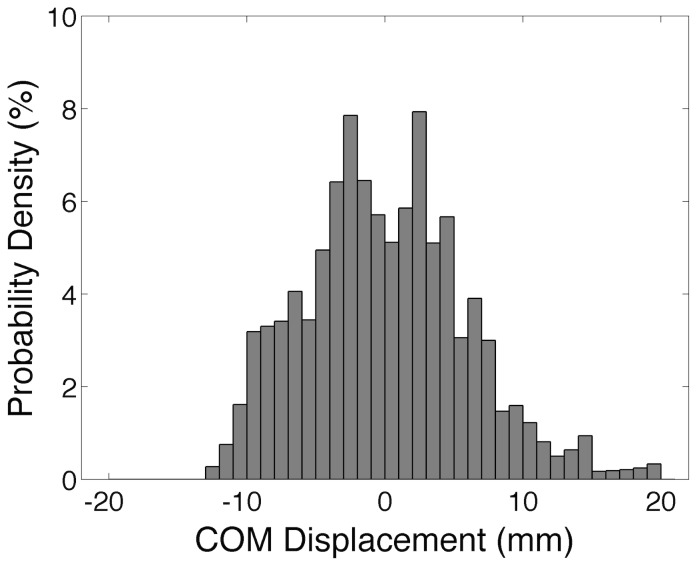
Figure 3. Pooled histogram of centre of mass (COM) displacements from the simulations performed on Model 2.
The mean values of COM displacement (mean equilibrium positions of the inverted pendulum) were subtracted from each simulated COM time series so that the data from different simulation runs could be pooled and hence plotted in the same graph. Note that the histogram exhibits a clear bimodal shape (see text for details).

