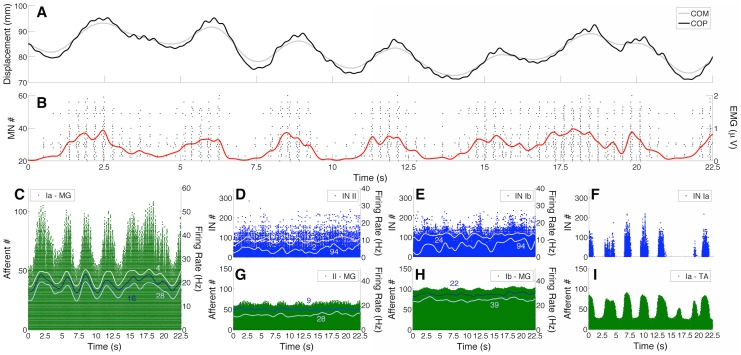
Figure 4. Intermittent recruitment of Medial Gastrocnemius (MG) motor units (MUs) and modulation of proprioceptive feedback (typical simulation performed on Model 2).
(A) Centre of mass (COM; gray curve) and centre of pressure (COP; black curve) displacements. (B) Raster plots (black dots) of  40 MG MUs intermittently recruited during quiet standing. Red curve represents the global MG electromyogram (EMG) envelope. Note the ballistic-like (phasic) activation of this muscle during postural sway. (C) Raster plots for the population of Ia afferents from the MG muscle. Note the clear modulation in the recruitment of primary afferents. In addition, continuous curves show the instantaneous firing rate (estimated by a Gaussian kernel convolved with the spike trains) for three Ia afferents (4, 16, 28). (D-F) Raster plots for group II excitatory interneurons (INs), Ib inhibitory INs, and Ia inhibitory INs. Continuous curves in panels D and E represent the instantaneous firing rate for two type-specified INs (2 and 94 for group II INs; 24 and 94 for Ib INs). (G-I) Raster plots for type II afferents from MG muscle spindle, Ib afferents from MG muscle spindle, and Ia afferents from TA muscle spindle. Continuous curves in panels G and H represent the instantaneous firing rate of two type-specified afferent fibres (9 and 28 for type-II afferents; 22 and 39 for Ib afferents).

