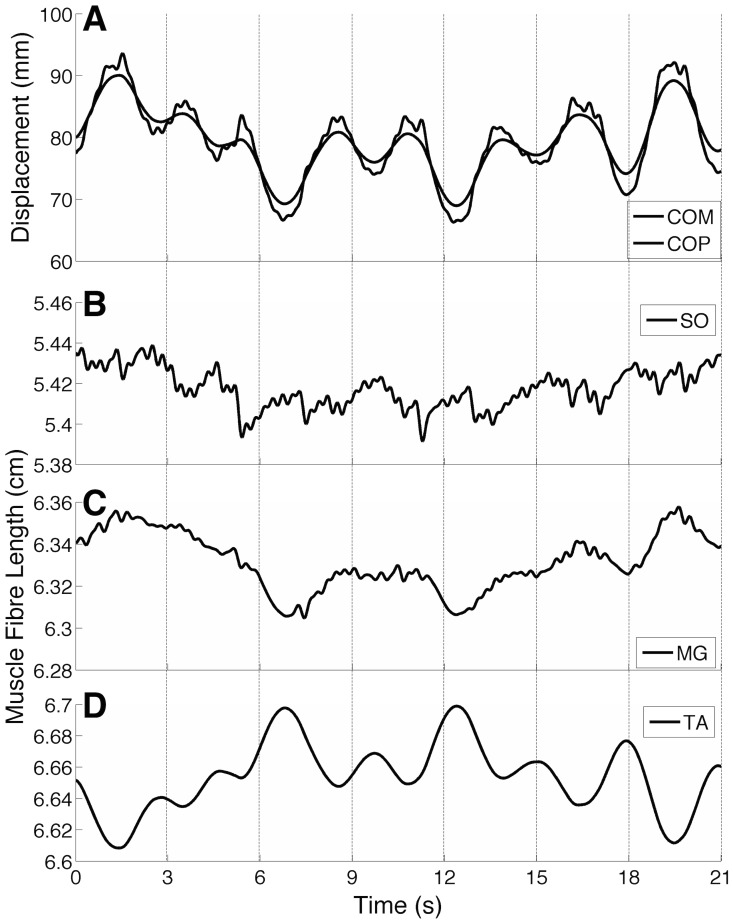
Figure 7. Modulation of muscle fibre lengths during postural sway (typical simulation performed on Model 2).
(A) Centre of mass (COM; gray curve) and centre of pressure (COP; black curve) displacements. (B-D) Muscle fibre lengths from Soleus (SO), Medial Gastrocnemius (MG), and Tibialis Anterior (TA) muscles. Lateral Gastrocnemius (LG) was not shown here because its behaviour is quite similar to that of the MG muscle. Dashed lines represent the 3-s duration windows used to perform the correlation analysis between COM and muscle fibre lengths (see Methods for details and Figure 8).

