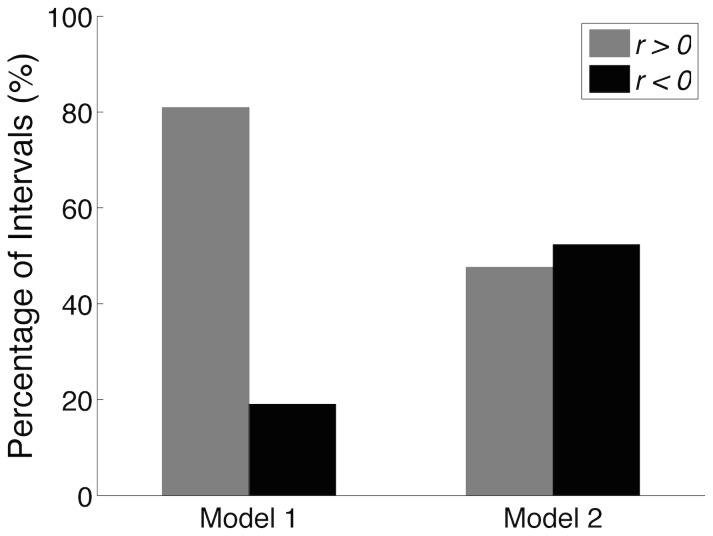
Figure 8. Correlation analysis between centre of mass (COM) displacement and Soleus (SO) muscle fibre length.
Each bar represents the percentage of intervals (3-s duration windows) with positive (gray) and negative (black) correlation coefficients for each model structure. For Model 1,  80% of intervals (17/21) had positive correlation coefficients, while for Model 2 this proportion was lower than 50% (10/21). Statistically significant difference was observed between the results from the two model structures (Model 1 vs. Model 2,
  -test,
  ). These results suggest that reciprocal inhibition may contribute significantly to the “paradoxical” behaviour (negative correlation between COM and muscle fibre length) reported in the literature [29]–[31].

