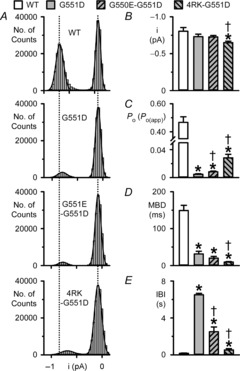
Figure 6. Quantification of single-channel data.

A, current amplitude histograms of single CFTR Cl− channels in excised inside-out membrane patches from BHK cells expressing the indicated CFTR constructs. The continuous lines represent the fit of Gaussian distributions to the data and the vertical dotted lines indicate the positions of the open and closed channel levels of WT-CFTR; the closed channel amplitude is shown on the right. B–E, single-channel current amplitude (i), open probability (Po) or apparent open probability (Po(app)), mean burst duration (MBD) and interburst interval (IBI) of the indicated CFTR constructs. All wild-type CFTR data are from membrane patches containing a single active CFTR Cl− channel, whereas for G551D-, G550E-G551D- and 4RK-G551D-CFTR, Po(app) and burst analysis data are from membrane patches containing ≤ 5 active channels and ≤ 3 active channels, respectively. Data are means + SEM (WT-CFTR, n = 6; G551D-CFTR, i and Po(app), n = 5, MBD and IBI, n = 3; G550E-G551D-CFTR, i and Po(app), n = 12, MBD and IBI, n = 6; 4RK-G551D-CFTR, i and Po(app), n = 12, MBD and IBI, n = 5). *Significantly different from WT-CFTR (P < 0.05); †significantly different from G551D-CFTR (P < 0.05).
