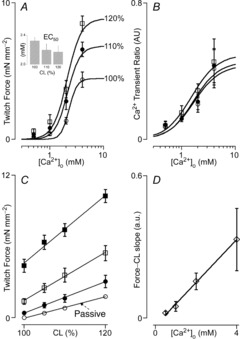
Figure 2. Impact of extracellular [Ca2+] and cell length on twitch force.

A, twitch force–extracellular [Ca2+] relationships (n = 10). Increased cell length (CL) from baseline (open circles) to 10% (filled circles) and 20% (open squares) CL induced a leftward shift in the relationship, indicating enhanced sensitivity to [Ca2+]o; this is confirmed by the decrease in EC50 ([Ca2+]o at 50% maximum twitch force; inset). B, intracellular [Ca2+], assayed by Indo-1 fluorescence ratio, increased as a function of [Ca2+]o, but was independent of CL (n = 10; symbols as in A). C, twitch force increased as a function of CL at [Ca2+]o = 1 mm (filled circles), 2 mm (open squares) and 4 mm (filled squares); passive force (open circles; arrow) also increased as a function of CL, but was not affected by [Ca2+]o. D, the twitch force–CL slope increased as a function of [Ca2+]o (n = 7).
