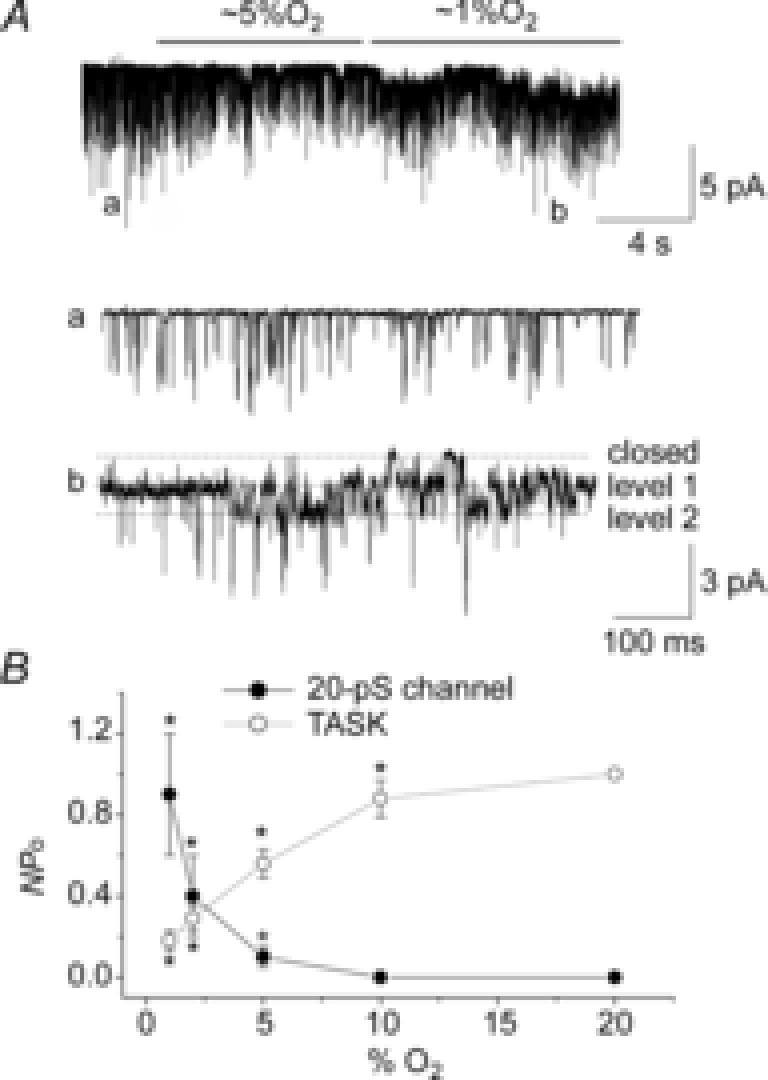
Figure 2. Relationship between O2 pressure and channel activity.

A, example trace of a cell-attached patch recording in response to two different levels of hypoxia. Expanded current tracings are also shown as indicated. Pipette potential was 0 mV and pipette solution contained 140 mm KCl. B, activities for TASK and 20 pS channels are plotted as a function of O2 content. For TASK, activity at 20% O2 was taken as 1.0. For the 20 pS channel, data were not normalized. Each point is mean ± SD (n = 5). *Significantly different from the control values obtained at 20% O2.
