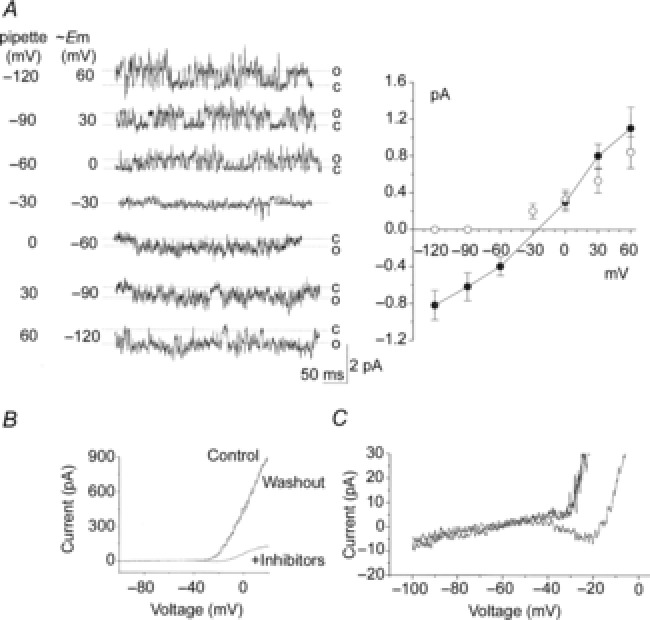
Figure 8. Determination of reversal potential of the 20 pS channel, and whole-cell currents with and without K+ channel inhibitors.

A, tracings of channel currents from a cell-attached patch from a rat glomus cell formed with pipette and bath solutions containing 5 mm KCl and 135 mm NaCl (physiological solution). FPL64176 was added to the bath solution to activate the 20 pS channel. Pipette potential was varied as shown. Amplitude levels of both TASK and the 20 pS channels were determined at each pipette potential. Cell membrane potential corresponding to each pipette potential was calculated as described in the text. Current amplitude levels were then plotted as function of cell potential. Straight lines were drawn between data points to determine the reversal potential for the 20 pS channel. Each point is the mean ± SD (n = 3). B, whole-cell currents were obtained before and after application of K+ channel inhibitors (TEA, 4-AP, iberiotoxin and E4301), and after washout. Whole-cell potential was held at −80 mV, and a 600 ms duration ramp voltage applied (−100 to +20 mV) every 5 s. Control current and the current after washout of inhibitors overlapped in all recordings. C, expanded current tracing showing the negative slope in the I–V relationship when K+ channel inhibitors are present.
