
Figure 2. Measurements of subglottal pressure after SH.
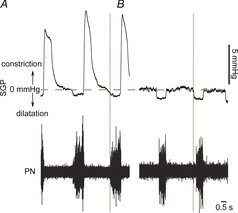
Simultaneous recordings of subglottal pressure, an index of upper airway resistance, and phrenic nerve activity (PN) of control (A) and SH (B) rats, representative of their respective groups. The vertical line indicates the moment when the upper airway resistance decreases before the onset of PN burst.