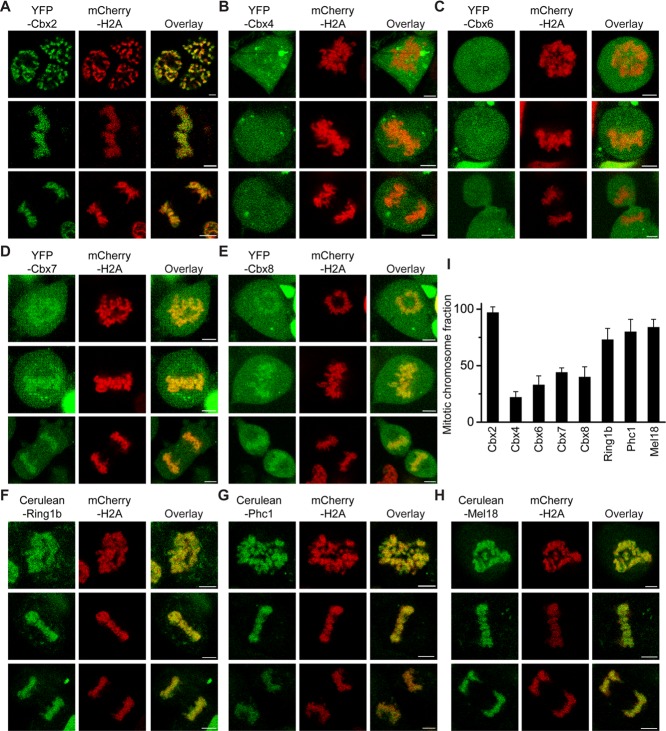
FIGURE 1:
Mitotic chromosomal association of PRC1 fusion proteins. (A–H) Confocal fluorescence images of PRC1 fusion proteins tagged with either YFP or Cerulean expressed in PGK12.1 ES cells in various phases of mitosis. The mCherry-H2A fusion protein was used to mark mitotic chromosomes. Prometaphase (top), metaphase (middle), and anaphase/telophase (bottom). Representative images from Z-scan stacks are presented in the figures. Scale bar, 5 μm. (I) Quantitative analysis of mitotic binding fraction of PRC1 fusion proteins at mitotic chromosomes. The mitotic binding fraction is the average of individual slices of Z-scan stacks. The data represent at least 10 cells analyzed. Error bars, SD of the mean.

