FIGURE 2:

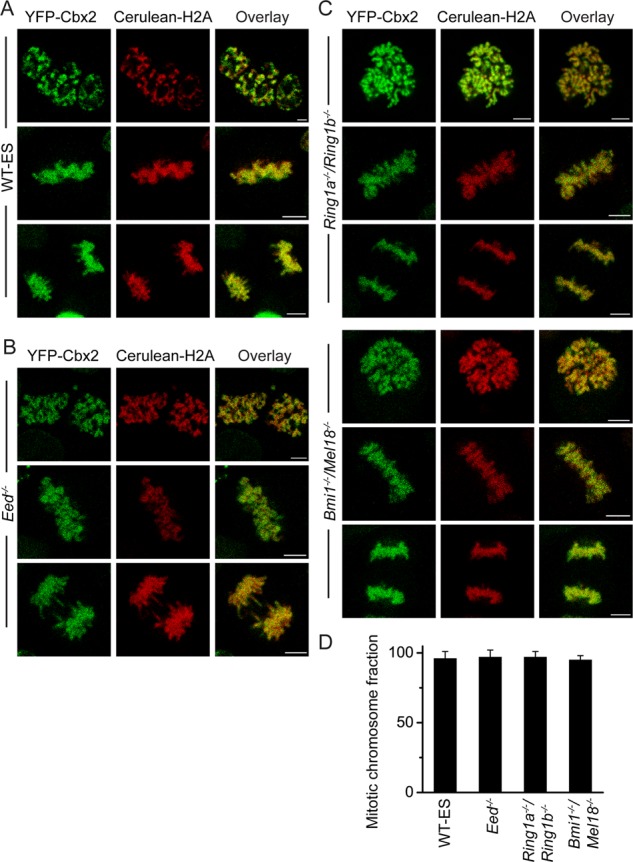
The association of Cbx2 fusion protein with mitotic chromosomes in PRC1 and PRC2 gene-knockout ES cells. (A) Confocal fluorescence images of YFP-Cbx2 fusion protein expressed in PGK12.1 ES cells (WT-ES). The different version of YFP-Cbx2 of Figure 1A is presented here in order to compare with B and C. Scale bar, 5 μm. (B) Confocal fluorescence images of YFP-Cbx2 fusion protein expressed in Eed−/− ES cells in various phases of mitosis. Prometaphase (top), metaphase (middle), and anaphase/telophase (bottom). Scale bar, 5 μm. (C) Confocal fluorescence images of YFP-Cbx2 fusion protein expressed in Ring1a−/−/Ring1bfl/fl and Bmi1−/−/Mel18−/− ES cell lines in various phases of mitosis. Prometaphase (top), metaphase (middle), and anaphase/telophase (bottom). The Ring1a−/−/Ring1bfl/fl was treated with OHT to induce depletion of Ring1b for 3 d before imaging. The protein level of Ring1b in Ring1a−/−/Ring1bfl/fl cells with or without OHT is presented in Supplemental Figure S5. Scale bar, 5 μm. (D) Quantitative analysis of mitotic binding fractions of YFP-Cbx2 fusion protein at mitotic chromosomes. The data represent at least 10 cells analyzed. Error bars, SD of the mean.
