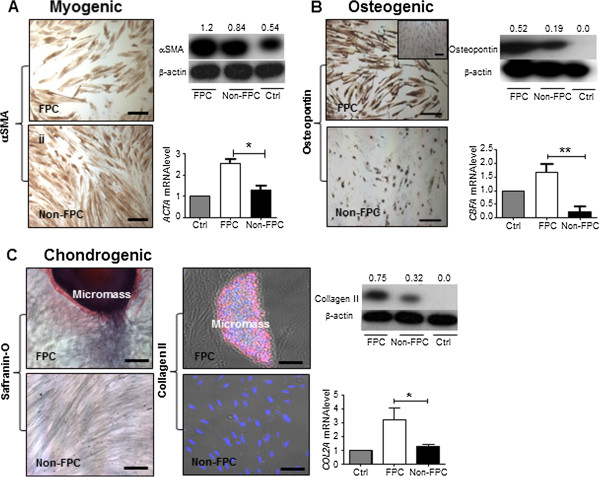
Figure 5.

Differentiation potential of human endometrial stromal FPC and non-FPC into mesenchymal lineages in vitro. Myogenic differentiation (A) with αSMA (brown) staining on cells clonally derived from stromal large CFU of FPC and non-FPC. Protein expression and quantification of αSMA. Relative gene expression level of ACTA by real time PCR. Osteogenic differentiation (B) with osteopontin (brown) staining on cells clonally derived from stromal large CFU of FPC and non-FPC. Protein bands and quantification expression of osteopontin. Relative gene expression level of CBFA1 by real-time PCR. Chondrogenic differentiation (C) with safranin-O (red) histochemical staining on cells clonally derived from stromal large CFU of FPC and non-FPC. Immunofluorescent staining with DAPI (blue) and collagen II (pink) on stromal large CFU of FPC and non-FPC. Micromass structure depicted from FPC chondrogenic induced cells. Protein bands and quantification expression of collagen II. Relative gene expression level of COL2A1 by real-time PCR. mRNA expression levels were normalized to 18S. Expression of the control was set as one. Control cells stained for lineage markers shown in inset and western blots are unselected stromal cells grown in culture medium with fetal bovine serum for four weeks. Scale bar: 200 μm, including inset. Results shown from a single sample representative of three patients. Results are reported as means ± SEM for western blotting (n = 3) and for real-time PCR (n = 6), *P < 0.05, **P < 0.01. αSMA (ACTA), alpha smooth muscle actin; CBFA1: core binding factor 1; CFU, colony-forming unit; COL2A1: collagen type II alpha 1; FPC, fluorescent persistent cells; SEM, standard error of the mean.
