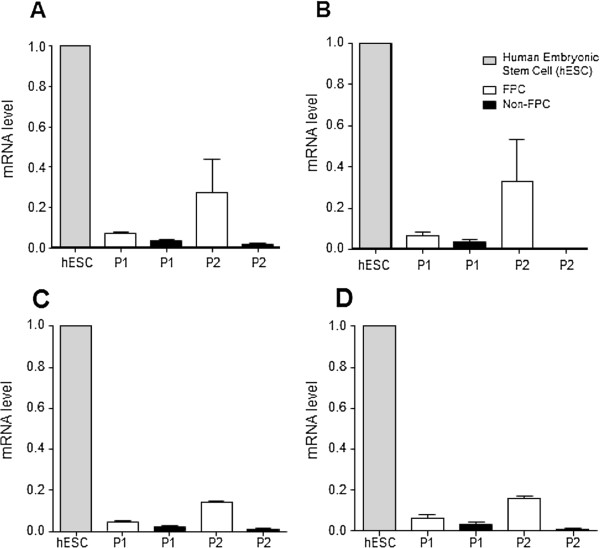
Figure 6.

Expression of pluripotent and self-renewal genes. The relative gene expression levels of (A)NANOG, (B)SOX2, (C)OCT-4 and (D)BMI-1 of passage 1 and 2 (P1, P2) FPC (white bars) and non-FPC (black bars) in comparison to human embryonic stem cells (hESC, grey bars) as positive control. Results are reported as means ± SEM, n = 3. FPC, fluorescent persistent cells; SEM, standard error of the mean.
