Figure 5.

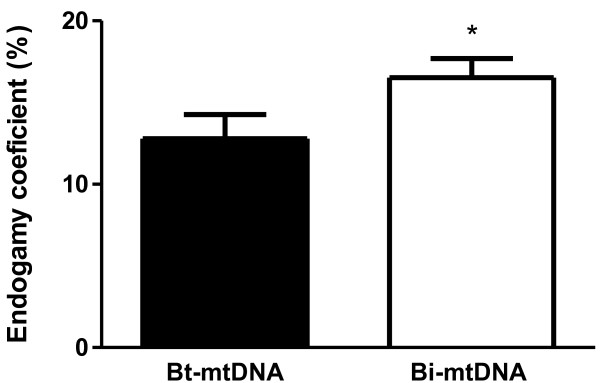
Endogamy coefficient in Guzerat calves either with Bt-mtDNA (n = 18) sequences or with Bi-mtDNA (n = 25). Data represent mean and standard error. Statistically significant differences are indicated by asterisks (* p < 0.05).

Endogamy coefficient in Guzerat calves either with Bt-mtDNA (n = 18) sequences or with Bi-mtDNA (n = 25). Data represent mean and standard error. Statistically significant differences are indicated by asterisks (* p < 0.05).