Figure 3.

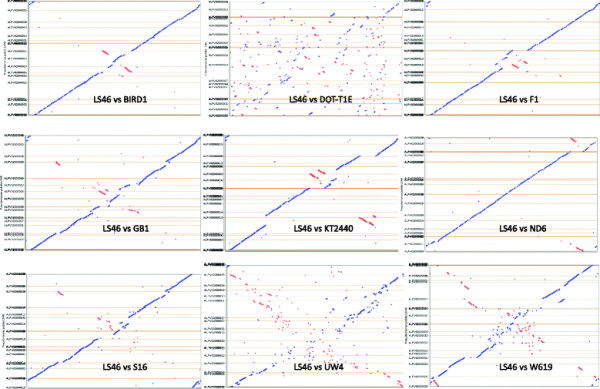
Comparative Synteny Dot plot ofP.putidastrains showing orthologous relationship ofP. putidaLS46 with nineP.putidastrains. The analysis was carried out using the Dot plot from Integrated Microbial Genome (IMG) website.

Comparative Synteny Dot plot ofP.putidastrains showing orthologous relationship ofP. putidaLS46 with nineP.putidastrains. The analysis was carried out using the Dot plot from Integrated Microbial Genome (IMG) website.