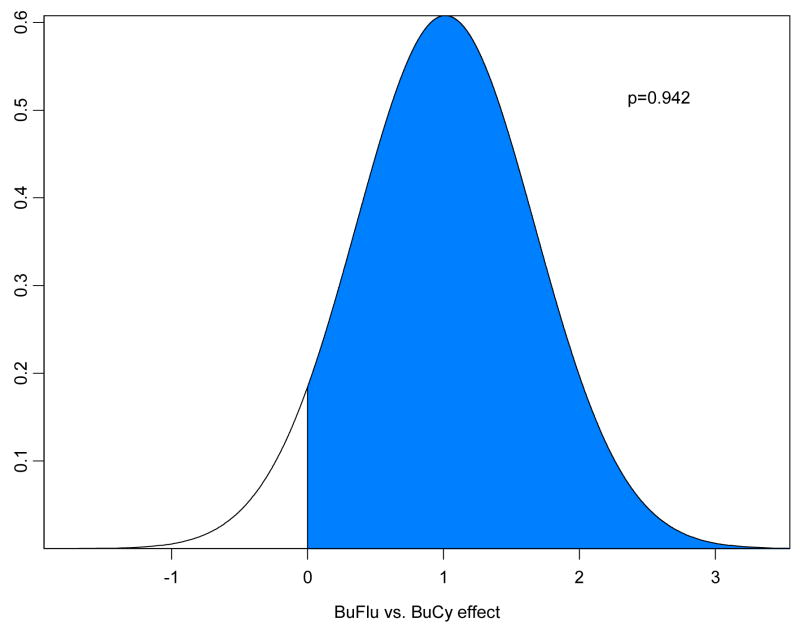
Figure 4.
Posterior distribution under the lognormal regression model for (a) Overall Survival, and (b) Event-Free Survival of the corrected Bu-Flu vs. BuCy2 treatment effect. In these plots, p denotes the probability of a beneficial effect of Bu-Flu versus Bu Cy2, and is represented by the area of the shaded region in the respective figure.


