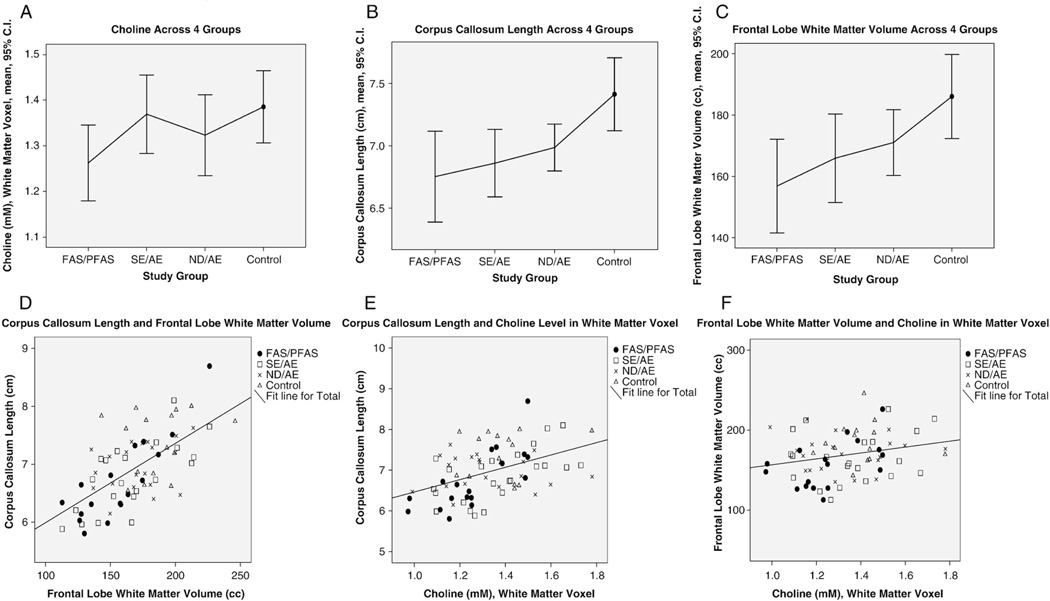
Fig. 6.
The FAS/PFAS group had (A) significantly lower wCho concentration in the white matter voxel, (B) shorter corpus callosum lengths and (C) smaller frontal lobe volumes than controls. (D) The smaller the frontal lobe, the shorter the corpus callosum (Pearson correlation coefficient 0.64; P<.001). (E) The shorter the corpus callosum, the lower the wCho concentration (Pearson correlation coefficient 0.45; P<.001). (F) The smaller the frontal lobe, the lower the wCho concentration (Pearson correlation coefficient 0.24; P=.04). Four study groups: FAS/Partial FAS, SE/AE; ND/AE; healthy control with no alcohol exposure.

