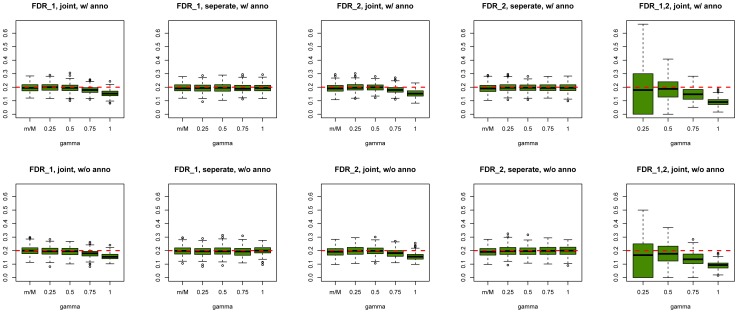
Figure 2. Global false discovery rates of GPA at sample size  = 5000 and number of risk SNPs
  = 1000.
Upper panel: Global false discovery rates of GPA with annotation. Lower panel: Global false discovery rates of GPA without annotation. From left to right: FDR of first GWAS (joint analysis), FDR of second GWAS (joint analysis), FDR of first GWAS (separate analysis), FDR of second GWAS (separate analysis) and FDR of risk variants shared by both GWAS. For all scenarios, the global false discovery rates of GPA are controlled at the nominal level.

