
Figure 4. The comparison between GPA and GSEA at number of risk SNPs  = 1000.

Here we fixed  and varied
 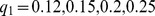 to evaluate the power for sample size
  = 2000 (Upper Left panel), 5000 (Upper Right panel), 10000 (Lower Left panel), respectively. We used
  to evaluate the type I errors (Lower Right panel). The results are based on 500 simulations.