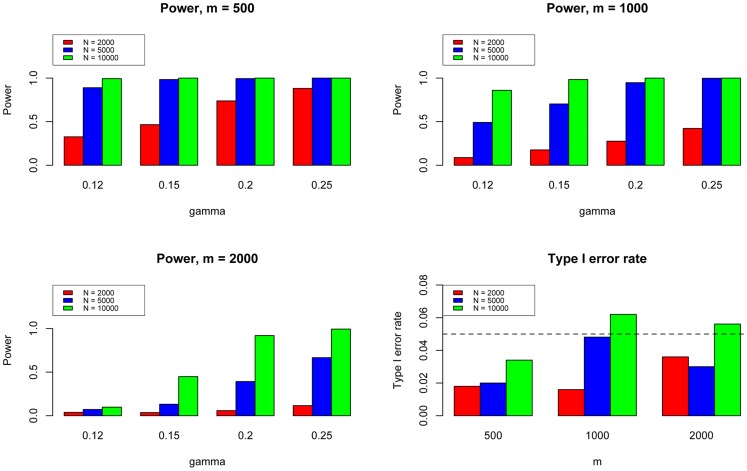
Figure 5. The type I error rate and power of the pleiotropy test. Here we varied  to evaluate the power for sample size
  = 500 (Upper Left panel), 1000 (Upper Right panel), and 2000 (Lower Left panel), respectively.
We used  to evaluate the type I errors of the pleiotropy test (Lower Right panel). In each setting, we also varied sample size
  = 1000, 2000, and 10000. Note that type I error rate and power of the pleiotropy test remain almost the same in presence of annotation (see Figure S9 in Text S1).

