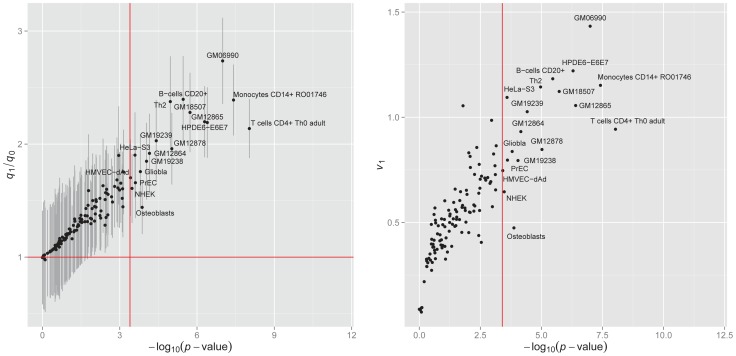
Figure 8. Enrichment of the DNase I hypersenstivity site annotation data from 125 cell lines for bladder cancer.
Left panel:  of hypothesis testing (13) vs. fold enrichment
  . The vertical red line corresponds to the significance level (
 = 0.05) after Bonferroni correction. The horizontal red line corresponds to ratio = 1. Right panel: The normalized variance component
  (2) given by LMM v.s.
  given by GPA.

