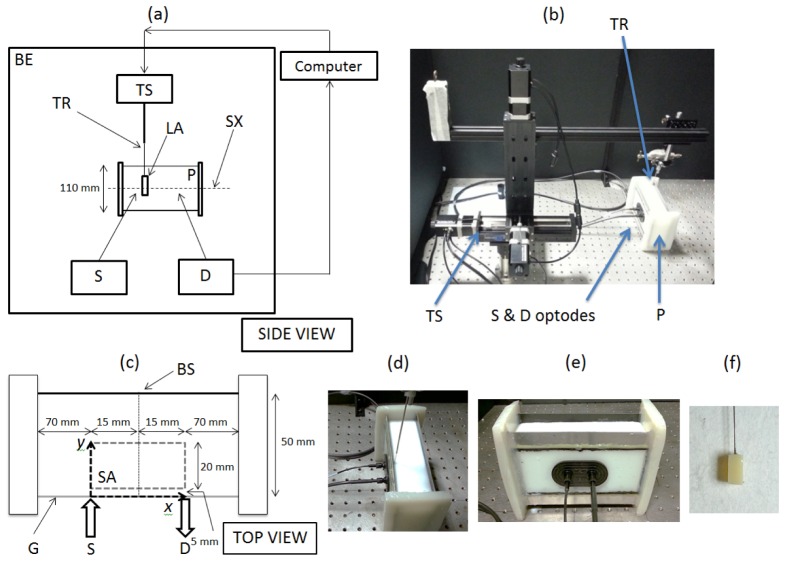
Fig. 1.
(a) Schematic diagram of the experimental setup in reflection mode [BE: black enclosure, TS: translation stage, TR: thin metallic rod, LA: local absorber, SX: scanning axis, P: phantom, S: optical source, D: optical detector]; (b) a picture of the setup; (c) Intralipid phantom: distance between S and D is 30 mm [BS: black surface, G: clear glass, y: y-axis distance from G, x: x-axis distance from S, SA: scanning area]; (d) and (e) alternative views of the Intralipid phantom with the TRS-20 optodes’ holder, which was attached using the provided adhesive; (f) an image of LA being held by a 0.5 mm TR.

