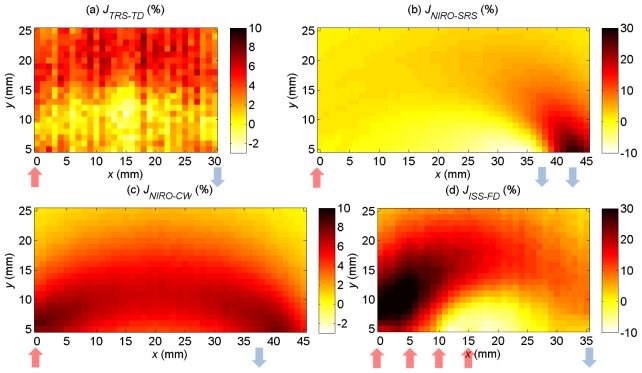
Fig. 3.
The spatial sensitivity maps J(x,y)* measured with 2 seconds of integration time: (a) TRS-20; (b) NIRO-100 using the SRS method; (c) NIRO-100 using the CW method; (d) ISS Oximeter; TRS-20 has the largest observable measurement variation but is generally more sensitive to deeper regions while other monitors are most sensitive to localized change in the SPL and their measurements have low variability. The color scales of (b) and (d) are deliberately kept distinct from others so the changes can be observable.

