
Fig. 5.
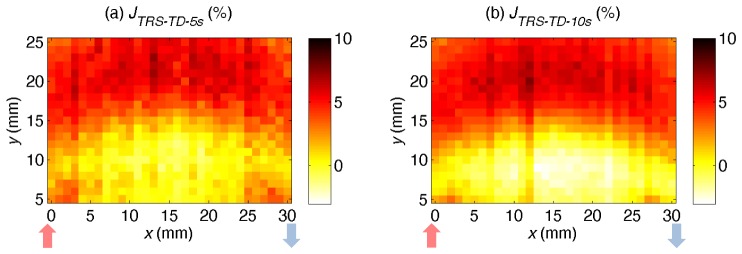
The spatial sensitivity map of the 760nm of the TRS-20 using an integration time of: (a) 5 and (b) 10 seconds; they show considerably improvement in %RSD (28.6% and 17.2% respectively) and the monitor is consistently most sensitive to deeper regions than SPL.