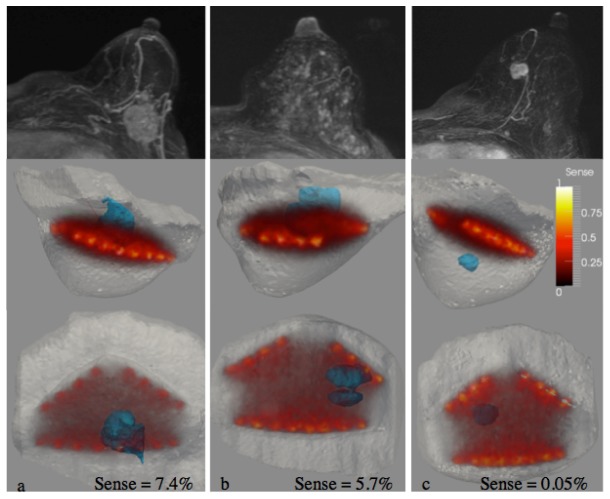
Fig. 1.
The Jacobian field is plotted within the MRI image volume of 3 different breasts with lesions (found by MRI) shown in blue. The overlap between the lesion and the Jacobian yields the sensitivity of the optical measurements to the lesion. These examples illustrate two cases (a,b) with good and one case with very poor sensitivity (c).

