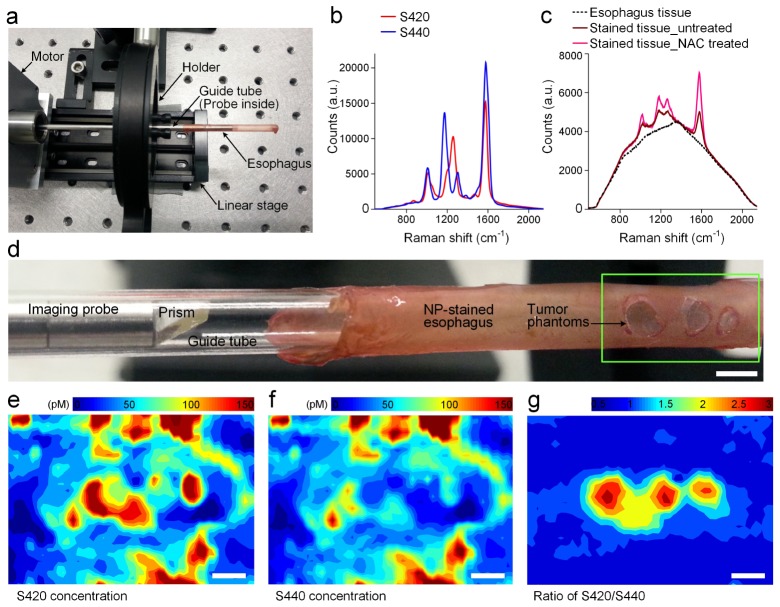
Fig. 4.
Ex vivo imaging of the rat esophagus. (a) Photograph of the Raman endoscope. (b) The reference spectra of the NP flavors S420 and S440; (c) Raw spectra from freshly excised esophagus and NP-stained esophagus (untreated or NAC-treated); (d) Zoom-in view showing the distal probe tip in a guide tube and tumor phantoms (green box) on a freshly excised rat esophagus. Images showing measured concentrations of S420 (e) and S440 (f), as well as the concentration ratio of S420/S440 (g). Scale bars = 2 mm.

