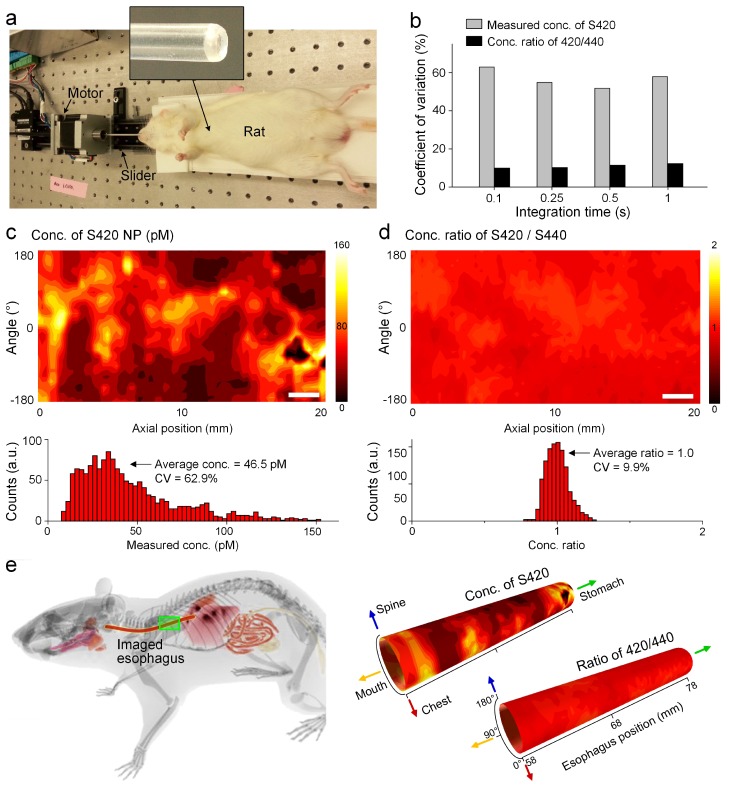
Fig. 5.
In vivo imaging performed after an oral-gavage protocol. (a) Photograph of the in vivo experimental system with an anesthetized rat. (b) CV of the imaged concentrations (S420) and concentration ratios (S420/S440) within the esophagus at different detector integration times showing that the NP ratios are relatively constant in spite of large fluctuations in absolute NP concentration. Images showing measured concentrations of S420 (c) and concentration ratios of S420/S440 (d). Scale bars = 2 mm. (e) Reconstructed esophagus images with physical coordinates. The lower teeth of the rat were used as a z = 0 reference point in the axial direction.

