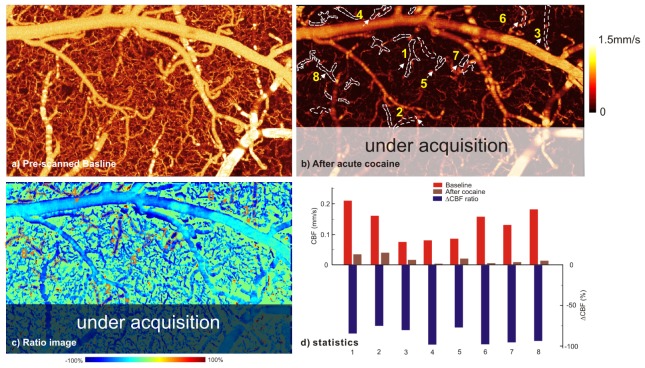
Fig. 9.
Ratio image to quickly track the ROIs, e.g., vessels with drastic flow decrease after repeated cocaine administration (2.5mg/kg/ea, iv). a) baseline CBFv image, b) currently updating CBFv image, c) ratio image of (b)/(a) to identify flow disruptions, d) statistical analysis of CBFv decrease. White dashed lines: ROIs with diminishing flows.

