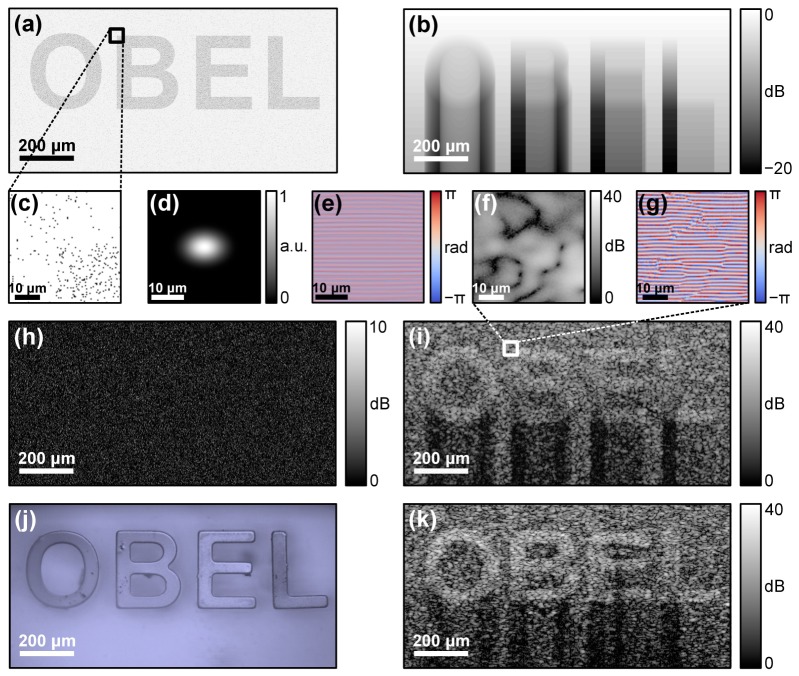
Fig. 1.
Illustration of the model of image formation in OCT, and comparison with experimental results. (a) Map of the locations of scattering potentials for the simulated OCT B-scan. (b) RM(x,z), the attenuation-scaled map of the reflected field amplitude. (c) Zoomed region of the highlighted area in (a). (d) and (e) Magnitude and phase, respectively, of the complex PSF. (f) and (g) Log-scale irradiance and phase, respectively, of the simulated OCT scan formed by convolving (c) with (d)–(e). (h) Irradiance of the added shot-noise. (i) Simulated OCT B-scan obtained by multiplying (a) with (b), convolving the result with (d)–(e), and adding (h). (j) and (k) Bright-field microscopy and experimental OCT B-scan, respectively, of the physical phantom; (j) was taken before adding scatterers to the bulk space surrounding the letters, (k) was taken after. (a)–(d) are in arbitrary units. (f), (h), (i) and (k) are scaled to the SNR of the OCT irradiance.

