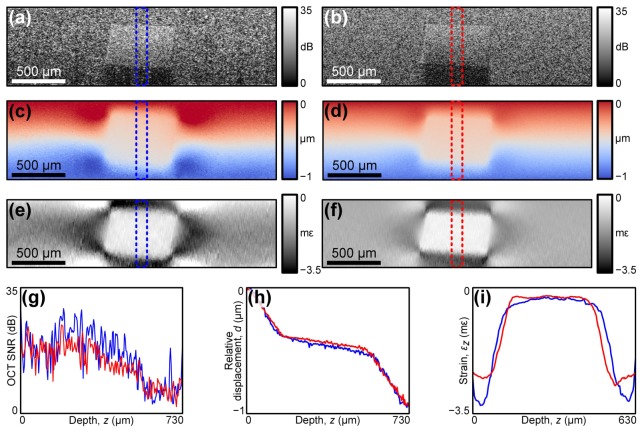
Fig. 6.
Experimental scans of a silicone inclusion phantom compared to results of the multiphysics simulation of phase-sensitive compression OCE. (a) Experimental and (b) simulated OCT SNR images. (c) Experimental and (d) simulated relative axial displacement within the loaded phantom. (e) Experimental and (f) simulated strain elastograms in units of milli-strain (mε). (g), (h), and (i) A-scan plots of irradiance, relative displacement and strain, respectively, of the experimental scans (blue) compared to the simulation (red). A-scans are averaged over a 30 µm lateral region indicated by the blue and red dotted boxes in (a)–(f).

