
Fig. 7.
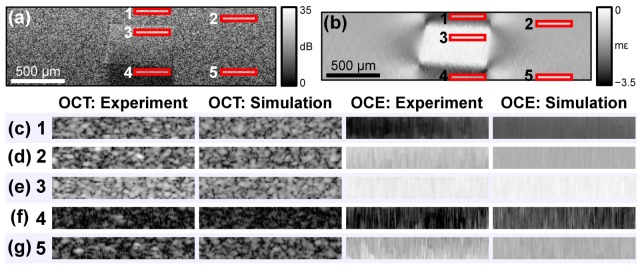
Regions used for comparing experiment to simulation, shown on (a) the simulated OCT image, and (b) the simulated strain elastogram. (c)–(g) Zoomed views of the 325 µm × 50 µm (x × z) regions 1–5, respectively, from the experimental and simulated OCT B-scans, and the experimental and simulated OCE strain elastograms.