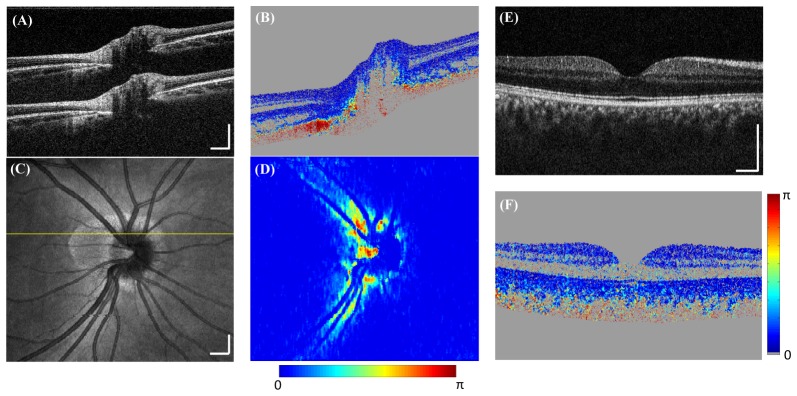
Fig. 5.

PS-OCT retinal imaging in healthy subjects. (A-D) Optic nerve head imaging. The scan area is 6mm × 6mm, with 1000 × 200 A-lines/volume acquired in 2.0s. (A) A cross-sectional intensity image with two depth-encoded copies. (B) Corresponding DPPR image shows high retardance in the RNFL and sclera. (C) OCT fundus image. (D) Corresponding fundus DPPR map shows high retardance around the optic disc region. (E-F) Macular imaging. (E) A single frame intensity image at the fovea region. (F) Corresponding DPPR image shows low retardance in the retinal layers. Scale bar: 500µm.
