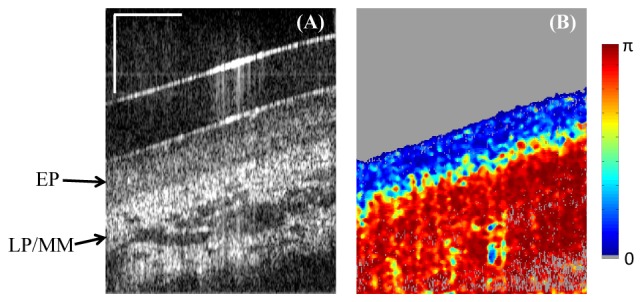
Fig. 8.

Ex vivo swine esophagus imaging by the catheter-based PS-OCT. (A) Single frame intensity shows the epithelium (EP) and lamia propria (LP) / muscularis mucosa (MM) layers. (B) Corresponding DPPR image shows low retardance at EP but high retardance at LP/MM. Horizontal scale bar: 30 degree; vertical scale bar: 500µm.
