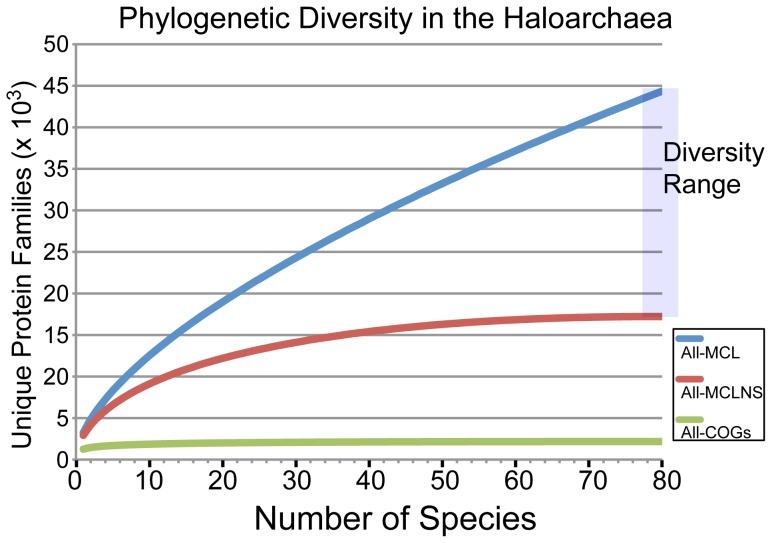
Figure 3. Rarefaction analysis of sampled haloarchaeal protein space.
A rarefaction curve of protein diversity was created for the 80 haloarchaea included in this study using three alternative methods to define protein families: COG number (green), TRIBE-MCL clusters removing singletons (red), and TRIBE-MCL clusters without removing singletons (blue). The COG database is expected to represent an under-estimate of the true diversity. Similarly, using TRIBE-MCL clusters with all singleton genes excluded underestimates true diversity. The true diversity of the set is likely located between the blue and red curves.

