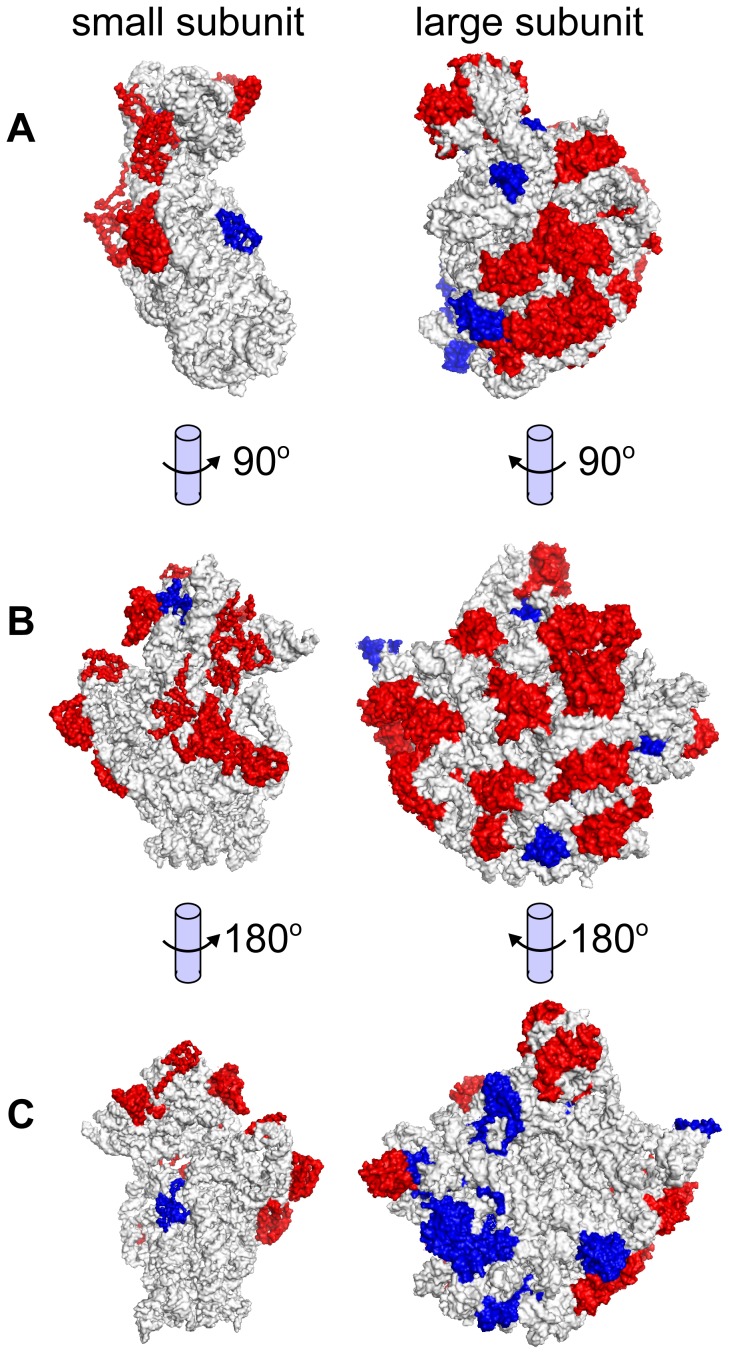
Figure 6. Ribosomal subunit isoelectric points.
Structural mappings of the large and small ribosomal subunits, showing protein monomers with predicted low (red) and high (blue) pI. Subunits are oriented according to (A) complex formation, (B) cytoplasmic view of each subunit, and (C) internal view of each subunit. Subunits exposed to the cytoplasm tend to be acidified (red subunits, visible in B), while subunits buried within the ribosome tend to have an alkaline isoelectric point (blue subunits, visible in C). Structural models used were those for Thermus thermophilus (1FKA) [97] and Haloarcula marismortui (1QVG) [96].

