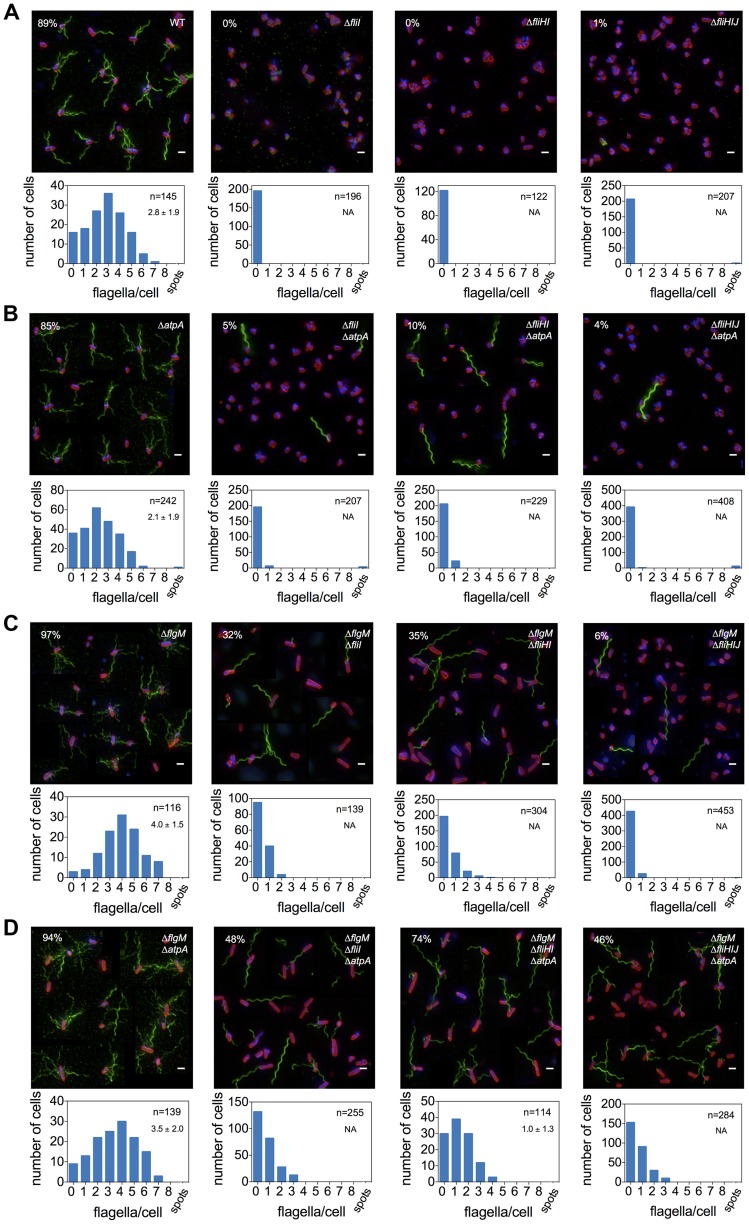
Figure 3. Frequency of flagellar filament formation of fliHIJ mutants is increased in atpA and flgM null backgrounds.
The absence of the flagellar ATPase subunits FliH, FliI and FliJ results in a non-flagellated phenotype (A). Additional deletions in atpA (B) and flgM (C) substantially increase the frequency of flagellar filament formation of fliI, fliHI and fliHIJ mutant strains. Flagellar formation in the flgM null background is further enhanced by combination with the atpA mutation (D). Top: A montage of representative fluorescent microscopy images is shown. Flagellar filaments were stained using anti-FliC immunostaining and detected by FITC-coupled secondary antibodies (green), DNA was stained using Hoechst (blue) and cell membranes using FM-64 (red). Scale bar 2 µm. The percentage of cells with at least one filament is presented in the upper left corner. Bottom: Histogram of counted flagellar filaments per cell body. Number of counted cells and average number of filaments per cell +/− standard deviation based on Gaussian non-linear regression analysis is given in the upper right hand corner.

