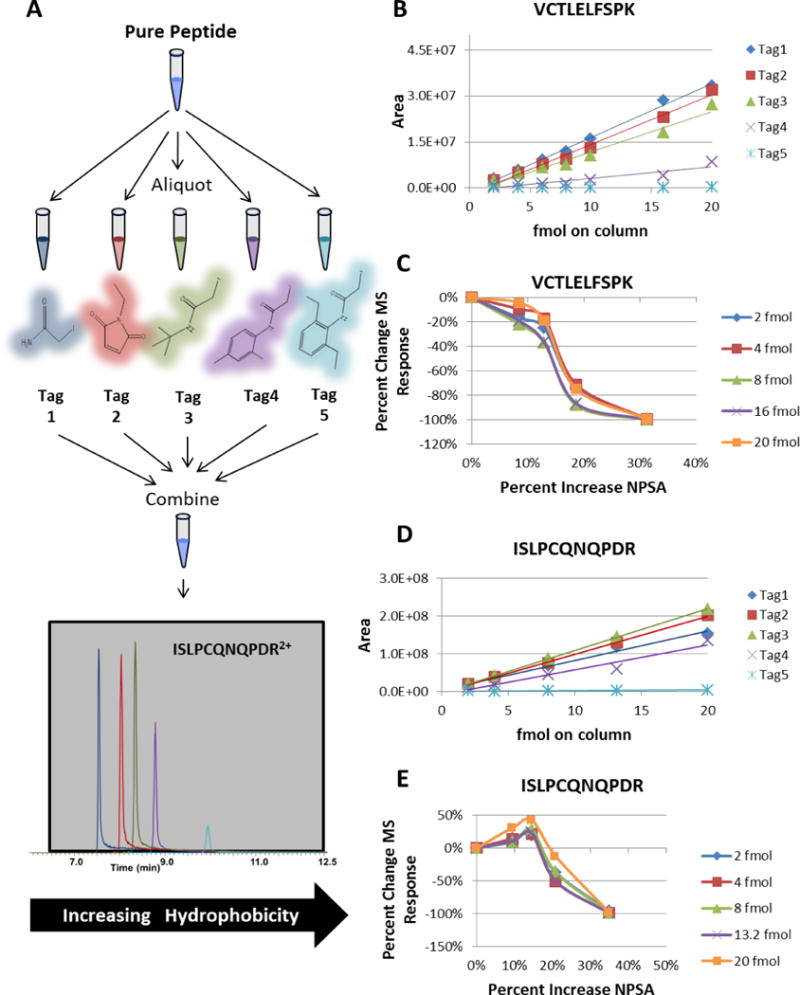
Figure 4.

A) The sample workflow for the tagging reactions. B) Average peak areas plotted versus different loading amounts for VCTLELFSPK modified with each tag. C) The percentage change in MS signal as a function of percentage change of NPSA for VCTLELFSPK. D) Average peak areas plotted versus different loading amounts for ISLPCQNQPDR modified with each tag. E) The percentage change in MS signal as a function of percentage change of NPSA for ISLPCQNQPDR.
