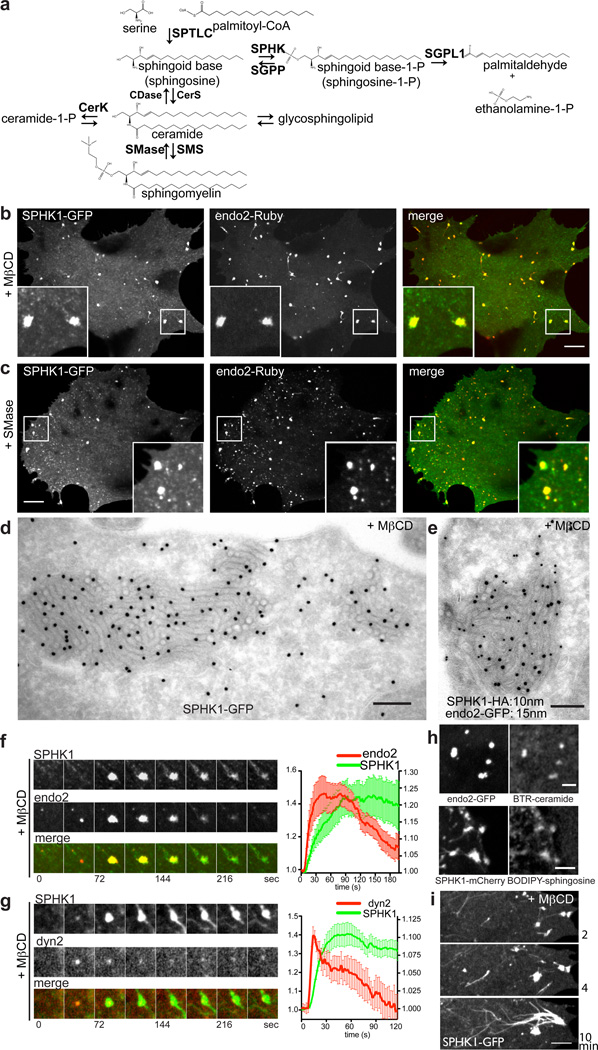
Figure 3. The sphingoid base modifying enzyme, sphingosine kinase 1 (SPHK1) is recruited to the tubular endocytic invaginations.
a. Sphingolipid metabolic pathway. SPTLC = serine palmitoyltransferase; SPHK = sphingosine kinase; SGPP = sphingosine-1-phosphate phosphatase; SGPL1 = sphingosine-1-phosphate lyase 1; CerS = ceramide synthase; CDase = ceramidase; SMS = sphingomyelin synthase; SMase = sphingomyelinase; CerK = ceramide kinase. b and c. GFP-tagged SPHK1 cosegregates into the clusters positive for Ruby-tagged endophilin 2 in cells treated with MβCD in b, or treated with SMase in c. d and e. Concentration of both SPHK1 and endophilin 2 on the endocytic tubular intermediates induced by MβCD treatment in a cell transfected with SPHK1-GFP alone in d or both SPHK1-HA and endophilin 2-GFP in e. Single or dual immunogold labeling with 15 nm gold particles for anti-GFP in c and e and 10 nm gold particles for anti-HA in e. f. Selected frames from a time series of a cluster colabeled for SPHK1-GFP and endophilin 2-Ruby (left). Fluorescence intensity of endophilin 2 (red) and SPHK1 (green) positive tubule clusters (n = 15 foci from 6 different cells) showing that recruitment of endophilin precedes SPHK1 (right). Pooled data from 6 independent experiments. Error bars: standard errors of the mean. g. Selected frames from a time series of a tubule cluster colabeled by SPHK1-GFP and dynamin 2-RFP (left). Fluorescence intensity of dynamin 2 (red) and SPHK1 (green) positive tubule clusters (n = 16 foci from 6 different cells) showing that recruitment of dynamin precedes SPHK1 (right). Pooled data from 6 independent experiments. Error bars: standard error of the mean. h. Tubule clusters formed after MβCD treatment are positive for fluorescent ceramide (BODIPY-TR-ceramide, top) and fluorescent sphingosine (BODIPY-sphingosine, bottom). i. Confocal images of a cell expressing SPHK1-GFP 2 min (top), 4 min (middle) and 10 min (bottom) after MβCD treatment. SPHK1 strongly labels filament-like structures originated from the clusters. Scale bar: 10 µm in b and c; 200 nm in d and e; 3 µm in h; and 5 µm in i.

