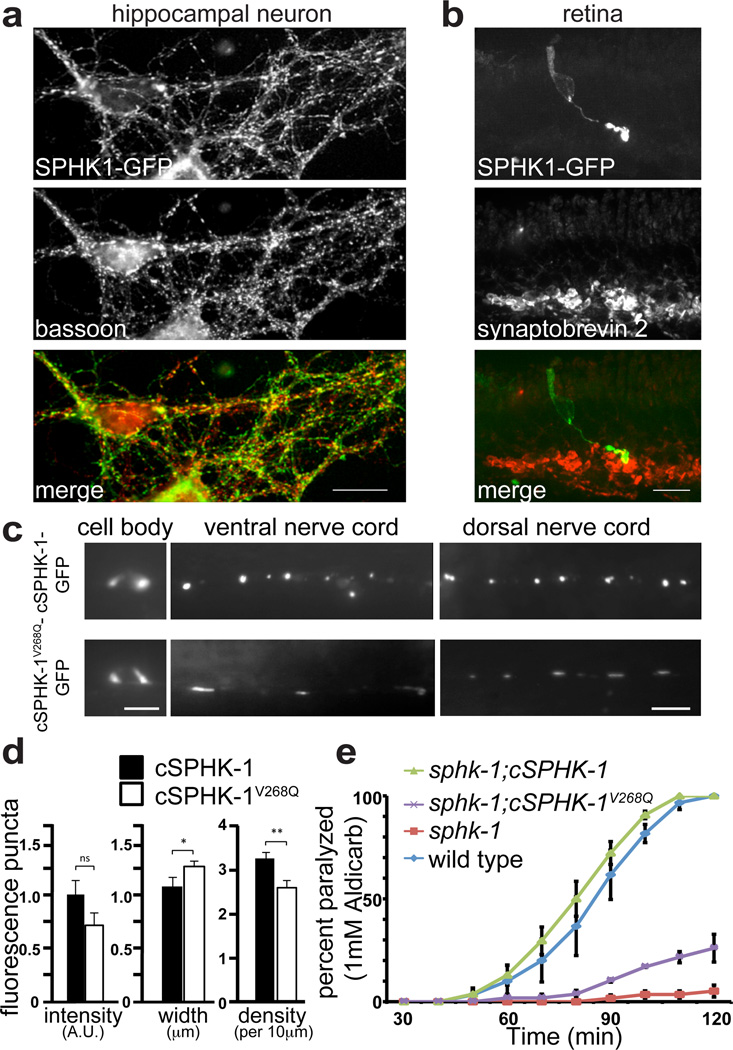
Figure 6. SPHK1 is concentrated at synapses and mutations that abolish membrane binding do not rescue synaptic transmission defects of loss-of-function mutants.
a. SPHK1-GFP is targeted to presynaptic terminals in cultured hippocampal neurons as shown by colocalization with immunoreactivity for Bassoon, a marker of pre-synaptic nerve terminals. b. SPHK1 is selectively enriched at the presynaptic terminal of photoreceptor cells in mouse retina. Z-projection confocal image of a mouse retina slice containing a SPHK1-GFP expressing rod cell (as a result of electroporation). The retina was fixed and immunostained for the synaptic vesicle marker synaptobrevin 2 to reveal synapses of the outer plexiform layer where the axon ending of the rod cell terminates. c – e. Analysis of worm sphingosine kinase (cSPHK-1). c. The localization of cSPHK-1WT-GFP or of the predicted membrane binding mutant cSPHK-1V268Q-GFP in the cell body (left), ventral (middle) and dorsal nerve cord (right) of motor neurons of C. elegans. d. Quantification of parameters of the fluorescence spots in the axon terminals (intensity, width and density) in wild-type animals expressing WT and mutant cSPHK-1. For cSPHK-1-GFP, n= 321 synapses from 17 worms, and for cSPHK-1V268Q-GFP, n=387 synapses from 23 worms. Each animal is an independent experiment, and data from independent experiments were pooled. Error bars: standard error of the mean. [ns] not significant; [*] P < 0.05; [**] P < 0.005, Student's t-test. e. Time-course of the onset of paralysis of the indicated worm strains upon exposure to the acetylcholine esterase inhibitor aldicarb (1 mM). sphk-1; cSPHK-1 and sphk-1;cSPHK-1V268Q stand for sphk-1 null mutants expressing full length worm SPHK-1-GFP or SPHK-1V268Q-GFP cDNA in neurons, respectively. A total of 60 worms were counted from each plate. Percentages were averaged at each time point per genotype and plotted graphically. n = 3 plates. The analysis was repeated two times, with two different transgenic lines. Data shown are from a single experiment. Error bars: standard error of the mean. Scale bar: 10 µm in a, 20 µm in b, and 10 µm in c.

