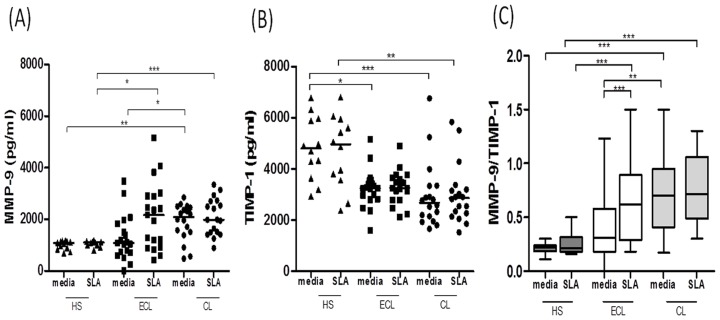
Figure 2. CL patients have high levels of MMP-9 and low levels of TIMP-1 when compared with healthy subjects.
PBMC were obtained from healthy subjects (HS) (n = 12), early CL (ECL) (n = 19) and CL patients (n = 18), and levels of MMP-9 (A) and TIMP-1 (B), determined by ELISA in culture supernatants of PBMCs upon stimulation with soluble Leishmania antigen (SLA) (5 µg/ml) for 72 hours. C, Ratio between MMP-9 and TIMP-1 in culture supernatants of PBMCs upon stimulation with SLA. The box-and-wickers plot shows the minimum, first quartile, median, third quartile, and maximum values of a set of data. The wickers represent error bars and those represent minimum and maximum values, indicating variability outside the upper and lower quartiles. Data shown from a representative experiment of five performances. *p<0.05; **p<0.005; ***p<0.0005.

