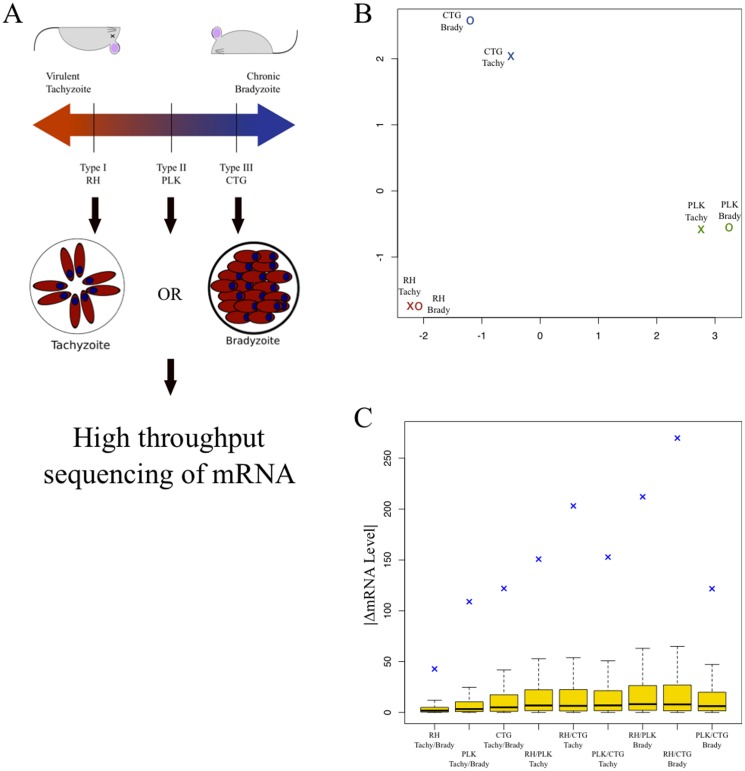
Figure 1. Patterns of gene expression vary more by strain than by developmental stage.
A) A representative strain from T. gondii lineages Types I (RH), II (PLK), and III (CTG) was selected and grown in tissue culture in either pH neutral conditions, conducive to tachyzoite growth or alkaline conditions, inducing bradyzoite differentiation. B) Multi-dimensional scaling (MDS) plot based on pairwise comparisons for each of the six experimental conditions. This is calculated as the root mean square deviation for the 500 most differentially expressed genes between any two conditions. The distance between any two points represents the average difference in expression levels (RPKM) of the most dissimilar genes, relative to differences observed between other conditions. In effect, the MDS plot provides an overview of the total amount of variation between samples. The axes show arbitrary distances. Experimental conditions include parasite strain (red = RH, green = PLK, blue = CTG) and by life cycle stage (X = tachyzoite, O = bradyzoite). Distances calculated using the 'plotMDS' function in the 'limma' Bioconductor package [30]. C) Boxplot represents absolute value of expression level difference between conditions. Interquartile regions are in gold, median differences are plotted as a solid black line. The root mean square deviation for each comparison is represented as a blue cross. From left to right, the first three groups are the intrastrain comparisons, tachyzoite vs. bradyzoite. The next three groups are interstrain comparisons between tachyzoite (unstressed) groups. The final three are are interstrain comparisons between bradyzoite (alkaline-stressed) groups).

