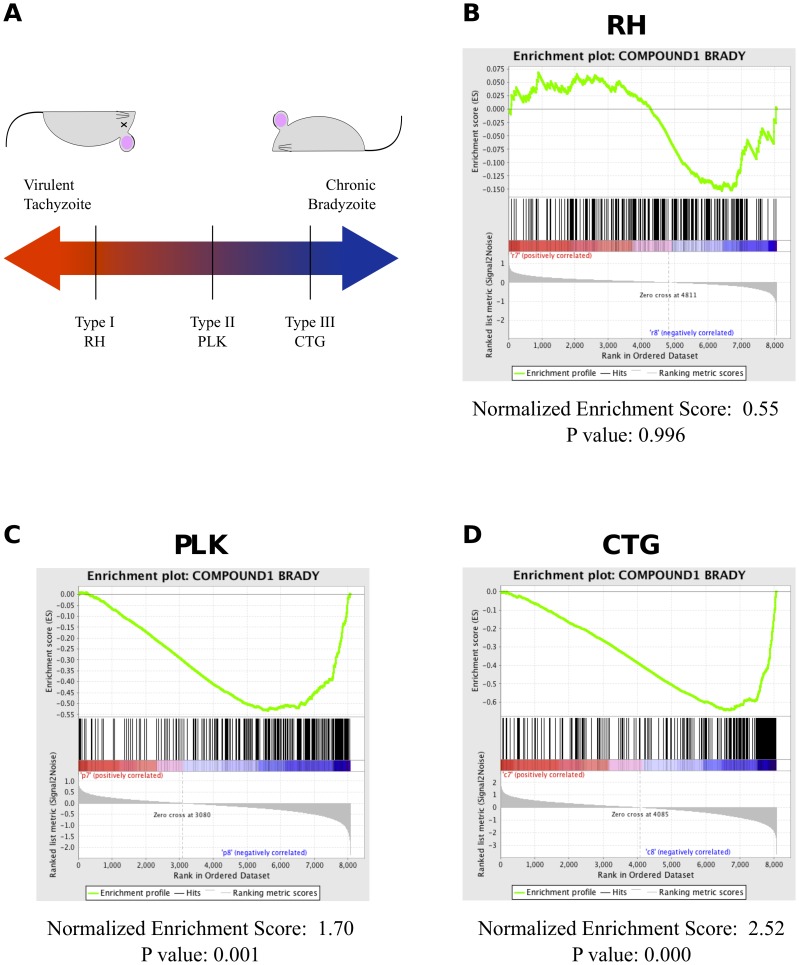
Figure 3. GSEA detects bradyzoite-induced genes in PLK and CTG, but not RH parasites.
(A) A schematic of strain virulence of the strains used as a function of ability to differentiate into bradyzoites. (B) GSEA enrichment plot for RH parasites under differentiation conditions compared to compound1 induced genes. Position of black bars indicate ranking of compound 1 genes relative to all other genes. Green line represents strength of enrichment under bradyzoite conditions (right) or tachyzoite conditions (left). (C) Enrichment plot for PLK parasites under differentiation conditions compared to compound 1 induced genes. (D) Enrichment plot for CTG parasites under differentiation conditions compared to compound 1 induced genes.

