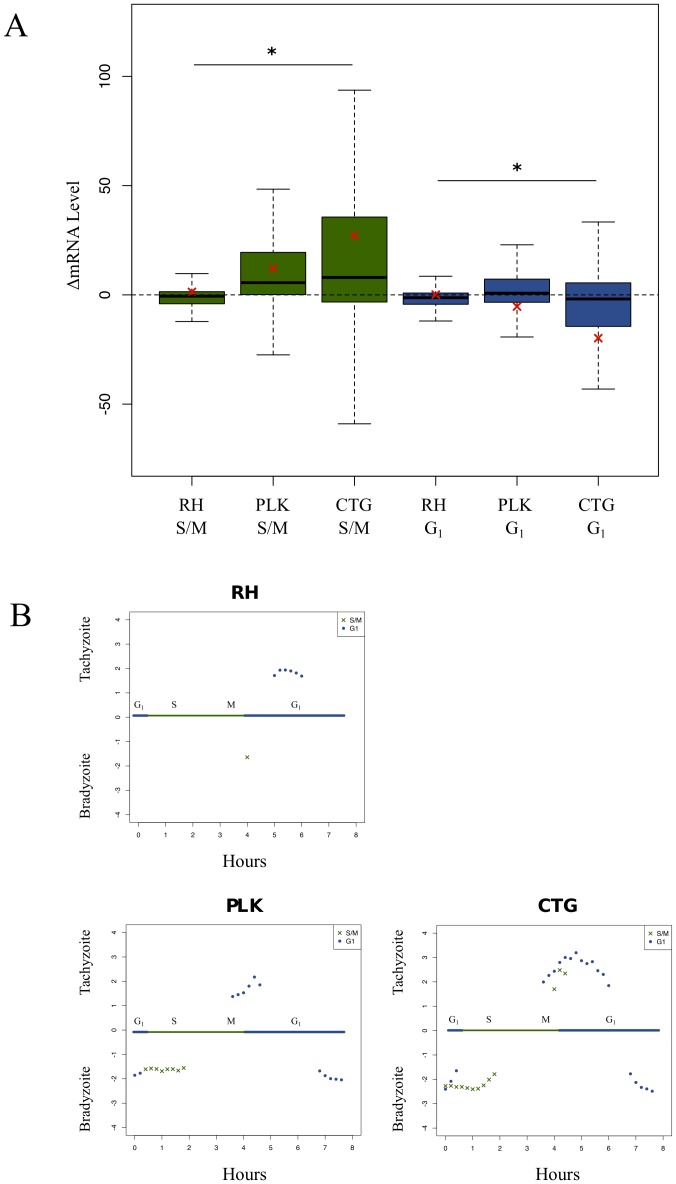
Figure 4. Expression of cell-cycle genes altered during differentiation.
A) Boxplot represents differences in expression levels of cell cycle-dependent genes following differentiation conditions. Green boxes represent changes in S/M gene expression, blue boxes represent changes in G1 gene expression. A positive difference indicates up regulation of the gene in tachyzoite conditions, while a negative difference in expression values indicates greater expression in the alkaline stress induced bradyzoites. The black bar indicates median value; the red cross indicates mean value. Significance tested by one-way ANOVA. A star (*) indicates: p<0.001. B) Cell cycle genes are annotated as either G1 or S/M [8]. We then sorted genes into groups based on time of peak expression. Each of these gene sets was tested by GSEA [26]. Gene sets with significant (FWER-p value <0.05) normalized enrichment scores (NES) are plotted. Positive scores indicate association with the unstressed (tachyzoite) condition, negative scores indicate association with the stress (bradyzoite) condition. Blue and green bar across middle of plots represent an eight hour RH tachyzoite cell cycle. Counter-clockwise from the top, the plots show cell cycle gene sets influenced following RH differentiation, cell cycle gene sets influenced following PLK differentiation, cell cycle gene sets influenced following CTG differentiation. Note that time of expression is based on the RH cell cycle as defined, which is shorter than that of either PLK or CTG.

