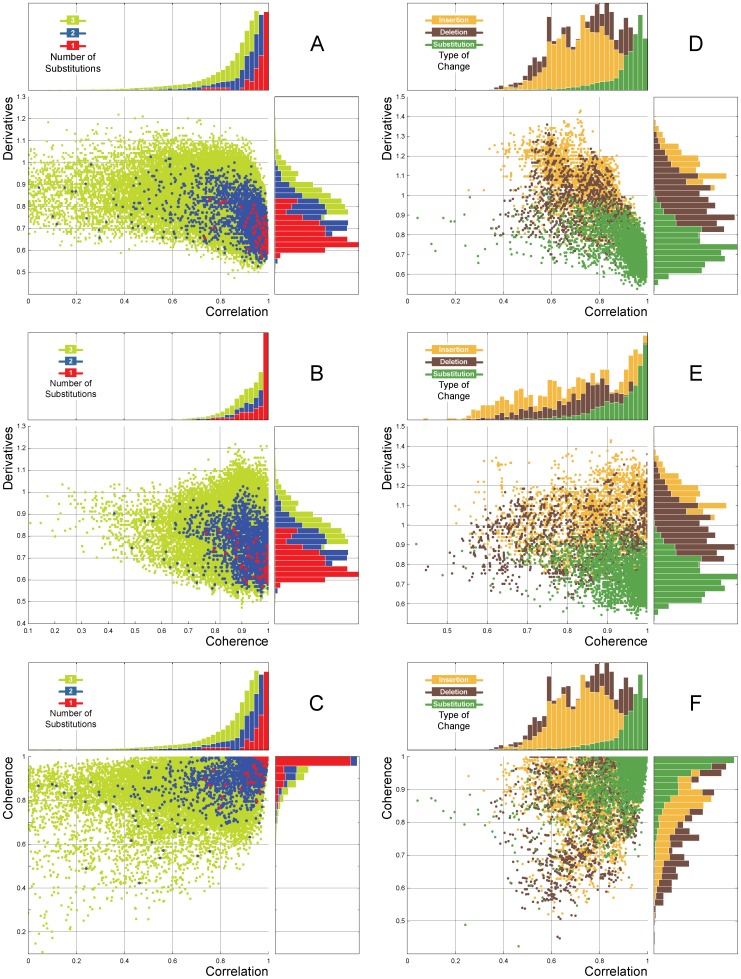
Figure 6. Depiction of the similarity space created with the three GSP distance descriptors.
A random 20 nt sequence was created. Using this sequence as a template, all possible combinations for up to three substitutions were created and measured against the template using the three distance descriptors. The dots in A, B, and C correspond to the distances for one (red), two (blue), and three (green) substitutions, respectively. As expected, the more substitutions present, the farther they scattered along the frequency peak. Subsequently, starting with the same template, all possible combinations of insertions, deletions, and substitutions were created and measured similarly as aforementioned. The dots in D, E, and F correspond to the distances for insertions (yellow), deletions (brown), and substitutions (green). The distance scatters shift between substitutions and indels, which is especially evident in the Correlation and Derivative descriptors. The blue scatter on A through C is equal to the green scatter on D through F.

