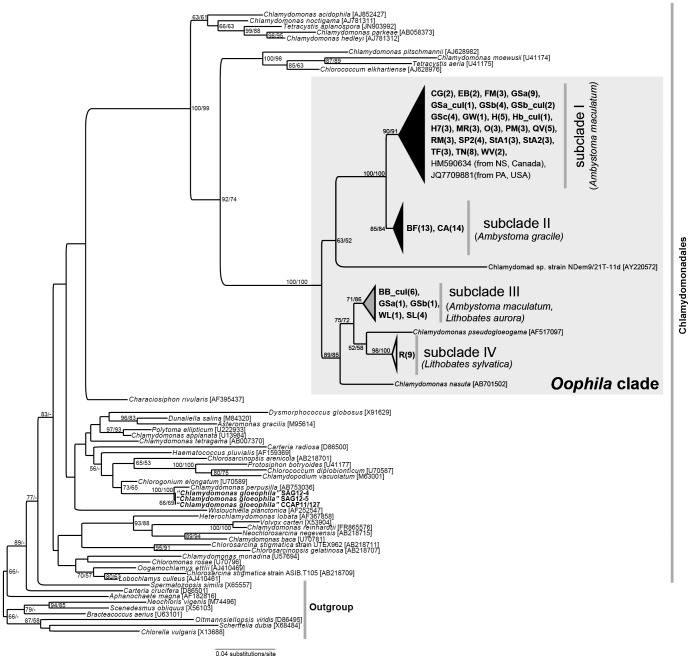
Figure 2. Maximum likelihood (ML) tree of algal 18S rDNA sequences from egg masses of four amphibian taxa from various North American localities.
The data matrix included 1,653 characters and 180 sequences. Newly obtained sequences are bold-faced. ML and MP bootstrap values greater than 50% are shown at corresponding nodes. Subclades I−IV are collapsed into triangles for visual clarity; an un-collapsed version of the tree can be found as Figure S1. Numbers in parentheses indicates the number of sequences obtained and analyzed for the corresponding sample. See Table 1 for naming conventions and GenBank accession numbers.

