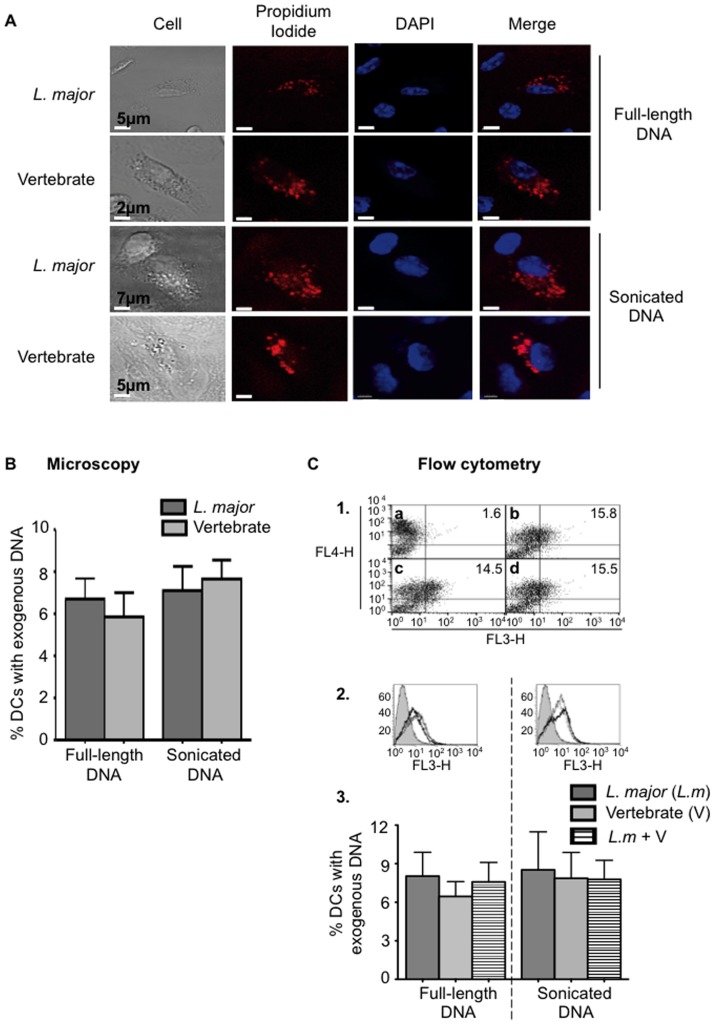
Figure 3. Comparative analysis of mouse and L. major DNA cell uptake.
Analysis by confocal microscopy (A, B) and flow cytometry (C) of BMDCs stimulated 1 h by 10 µg of full-length DNA or sonicated DNA (200 bp) from L. major or mouse labelled with propidium iodide (PI) (red). (A, B) Nuclei are stained with DAPI (blue). Quantification was performed by counting 250–300 BMDCs per condition per experiment. (C) Internalized DNA was detected in FL3 channel in BMDCs labelled with an anti-CD11c APC (FL4 channel). 1) Dot plots represent BMDCs alone (a) or incubated with L. major DNA (b), vertebrate DNA (c) or both DNAs (d). The percentage of BMDCs PI+CD11c+ (respectively in FL3 and FL4 channels) is indicated for each dot plot. 2) Filled and open histograms represent unstimulated or stimulated BMDCs with PI stained DNA. L. major DNA (L.m), vertebrate DNA (V) and L. major (10 µg) with vertebrate DNA (10 µg) (L.m+V) are represented respectively with a thin, solid and a dashed line. 3) Percentage of BMDCs with exogenous DNA. In the experience of uptake competition, only L. major DNA was stained with PI. The data represent three independent experiments: one representative for A C1 and C2 and the mean and SEM in B and C3.

